> ## Documentation Index
> Fetch the complete documentation index at: https://mintlify.com/iLotuus/Enterprise-SOC-Architecture/llms.txt
> Use this file to discover all available pages before exploring further.
# Architecture Overview
> High-level overview of the Enterprise SOC Architecture, including component layers, data flows, and system integration
# Architecture Overview
The Enterprise SOC Architecture is designed as a multi-layered system where each layer provides specific security capabilities. This overview explains the architectural structure, component integration, and data flows that enable comprehensive security operations.
## Architecture Diagram
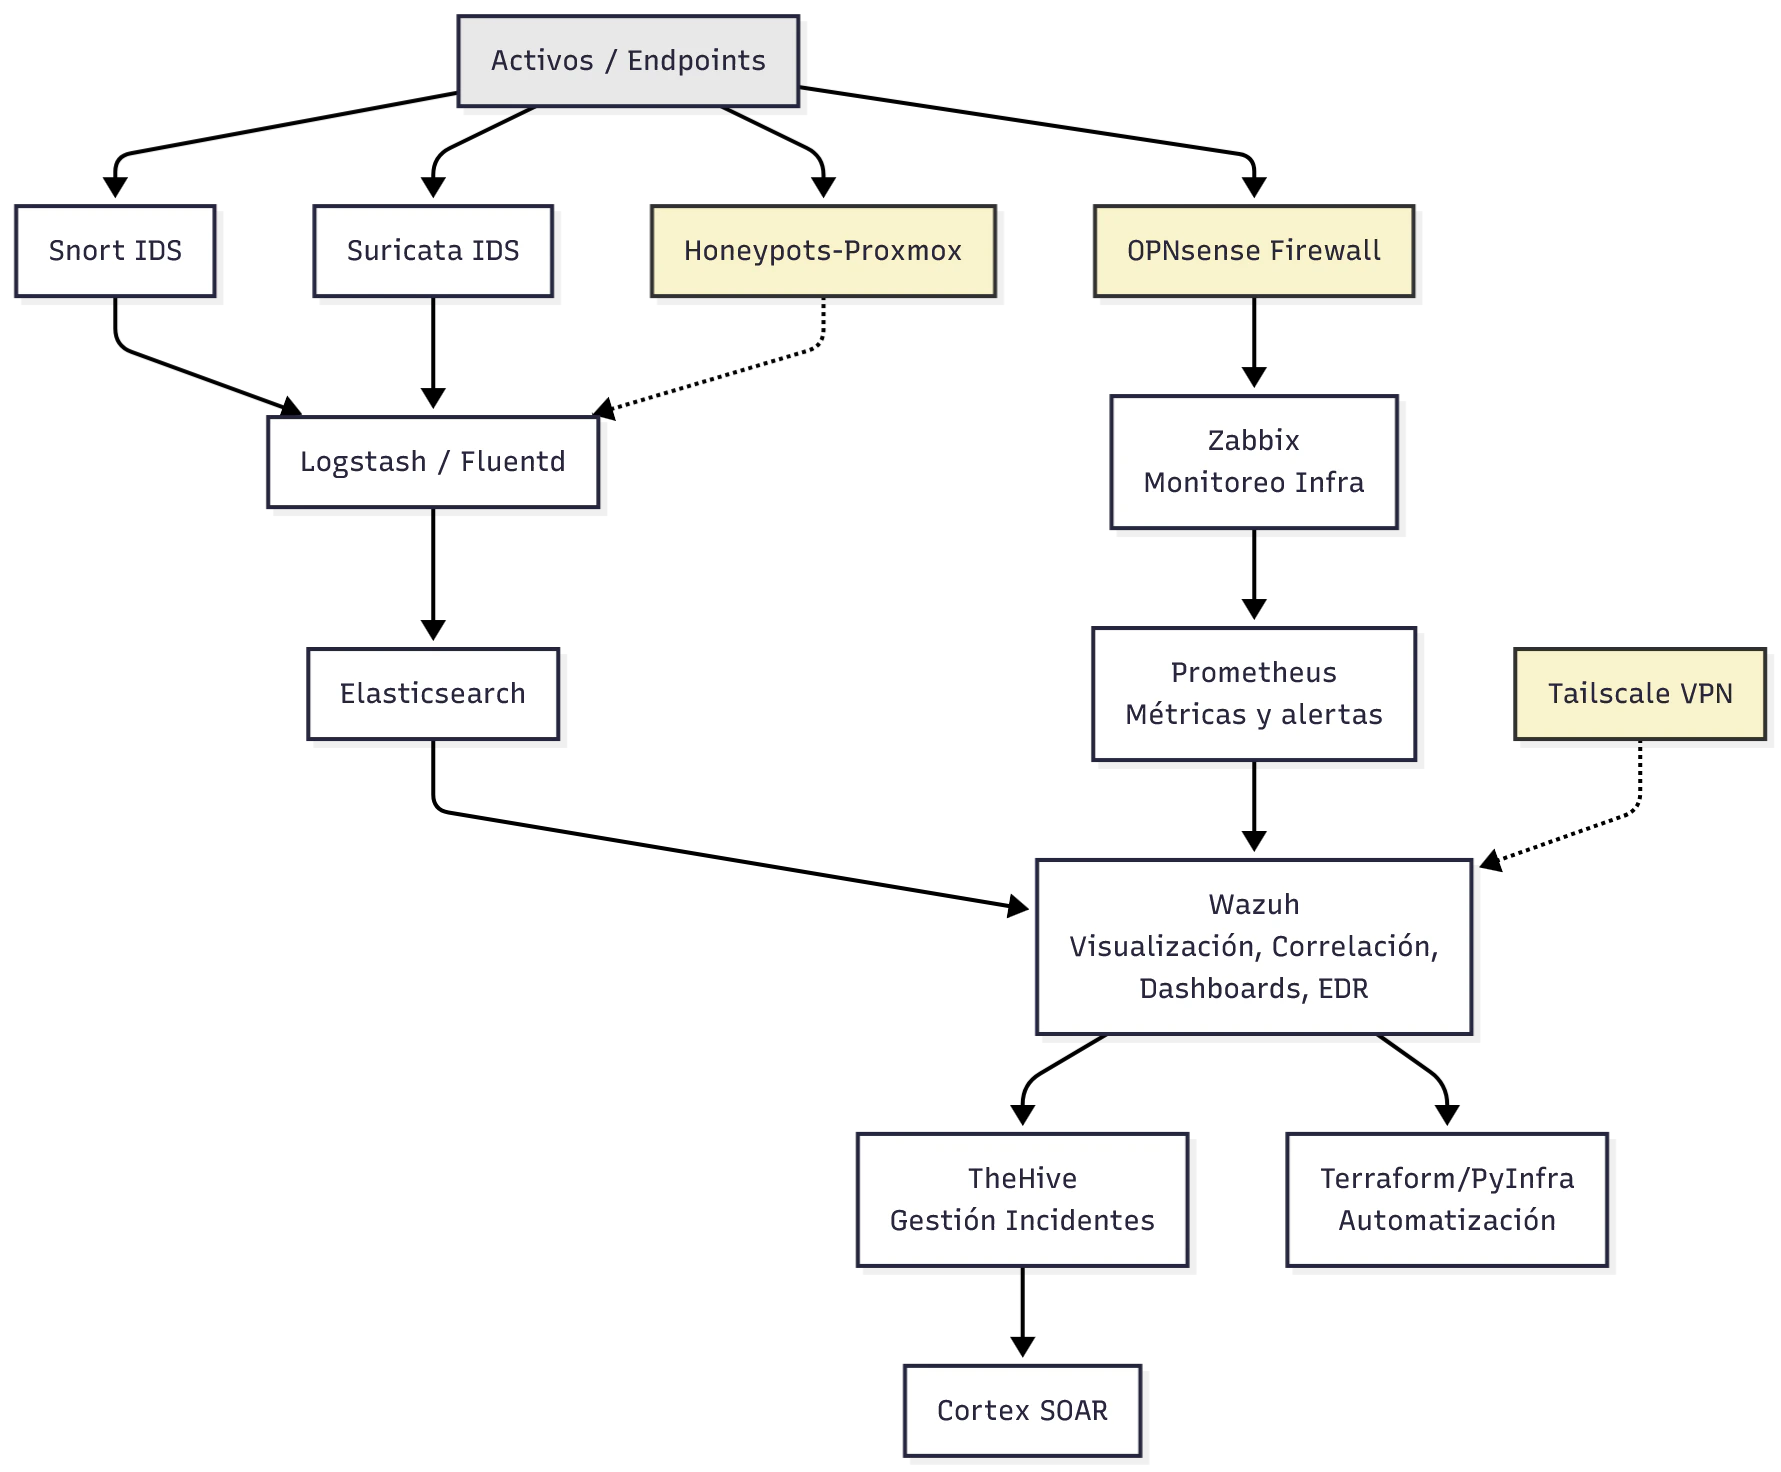 Components highlighted in **yellow** represent long-term planned features that will be implemented in future phases.
## Architectural Layers
The SOC architecture is organized into distinct functional layers that work together to provide end-to-end security operations:
Network-based intrusion detection and prevention systems that monitor traffic from endpoints
* Snort IDS (rule-based detection)
* Suricata IDS/IPS (high-performance detection)
Log collection and processing pipeline for normalizing and enriching security events
* Logstash/Fluentd (log aggregation)
* Elasticsearch (event storage and search)
Infrastructure and application monitoring for availability, performance, and metrics
* Zabbix (infrastructure monitoring)
* Prometheus (metrics and alerts)
Unified security platform for visualization, correlation, and endpoint protection
* Wazuh (SIEM/XDR capabilities)
Security incident tracking, investigation, and case management
* TheHive (incident response platform)
Automated response and infrastructure management
* Cortex (SOAR)
* Terraform/PyInfra (Infrastructure as Code)
## Data Flow Architecture
The architecture implements three primary data flows that ensure comprehensive security visibility:
**Endpoints → IDS (Snort/Suricata) → Logstash → Elasticsearch → Wazuh**
Network traffic from endpoints is analyzed by intrusion detection systems. Detected events are sent to the log aggregation pipeline, stored in Elasticsearch, and visualized in Wazuh for correlation and analysis.
**Endpoints → Firewall → Zabbix → Prometheus → Wazuh**
Infrastructure health and performance metrics flow through monitoring systems. Zabbix tracks availability and performance, Prometheus provides real-time metrics and alerting, and all data is integrated into Wazuh for unified visibility.
**Wazuh → TheHive → Cortex**
Security events identified in Wazuh trigger incident tickets in TheHive. Cortex orchestrates automated response actions based on predefined playbooks, enabling rapid containment and remediation.
**Honeypots/VPN → Logstash/Wazuh** *(Long-term plan)*
Planned integration of deception technology and secure remote access with the core security platform.
## Layer Deep Dive
### Detection Layer: IDS/IPS
The first line of defense monitors network traffic for malicious activity:
Snort provides lightweight, signature-based intrusion detection. It uses a comprehensive rule set to identify known attack patterns and suspicious network behavior.
**Key Capabilities**:
* Real-time traffic analysis
* Protocol analysis
* Content searching/matching
* Packet logging
Suricata offers advanced detection capabilities with multi-threading support for high-performance environments.
**Key Capabilities**:
* Multi-threaded processing
* IDS and IPS modes
* File extraction and analysis
* Lua scripting support
* TLS/SSL inspection
### Aggregation and Storage
Centralized log collection and storage enable correlation and forensic analysis:
**Logstash/Fluentd** act as the data pipeline, ingesting logs from multiple sources, parsing and normalizing data, and enriching events with additional context before forwarding to storage.
**Elasticsearch** provides the scalable storage backend with powerful search and analytics capabilities, enabling rapid queries across millions of security events.
### Infrastructure Monitoring
Comprehensive monitoring ensures security events are correlated with infrastructure health:
* **Zabbix**: Monitors server availability, resource utilization, and application performance. Provides alerting for infrastructure anomalies that may indicate security issues.
* **Prometheus**: Collects time-series metrics with a flexible query language, enabling real-time alerting and integration with visualization tools.
### Central Security Platform: Wazuh
Wazuh serves as the unified security platform, providing:
Customizable dashboards for real-time security event monitoring
Intelligent correlation rules to detect complex attack patterns
Endpoint detection and response for host-based security
Built-in compliance frameworks and reporting
### Incident Management and Orchestration
The incident response layer enables efficient security operations:
TheHive provides collaborative incident management with case tracking, task assignment, and investigation workflows. Security analysts can document findings, share intelligence, and track incident resolution.
Cortex automates repetitive security tasks through analyzers and responders. It can automatically enrich indicators, execute response actions, and integrate with external threat intelligence sources.
Infrastructure as Code tools enable automated deployment, configuration management, and response actions at the infrastructure level, ensuring consistent and repeatable security controls.
## Long-Term Planned Components
The following components are planned for future implementation and are shown in **yellow** in the architecture diagram:
These components represent the long-term vision and are subject to evaluation before implementation.
Virtualized deception technology to attract attackers and gather intelligence on tactics and techniques
Open-source perimeter firewall for network segmentation, traffic filtering, and additional intrusion prevention
Mesh VPN solution for secure remote access to the SOC infrastructure and management interfaces
## Integration Points
The architecture emphasizes seamless integration between components:
* **Bidirectional data flow** between monitoring and security platforms
* **Standardized log formats** for consistent parsing and correlation
* **API-based integration** for automated orchestration
* **Centralized authentication** (where applicable)
* **Unified alerting** through the Wazuh platform
The modular design allows components to be deployed incrementally, starting with core detection and monitoring capabilities and expanding to advanced orchestration and automation.
## Scalability Considerations
The architecture is designed to scale across multiple dimensions:
* **Horizontal scaling**: Add more IDS sensors, log processors, and storage nodes
* **Vertical scaling**: Increase resources for compute-intensive components like Elasticsearch
* **Geographic distribution**: Deploy regional sensors with centralized management
* **Data retention**: Configure tiered storage for cost-effective long-term retention
## Next Steps
To understand the design philosophy behind this architecture, continue to the [Design Principles](/design-principles) section. For detailed information about specific components, explore the Components section of the documentation.
Components highlighted in **yellow** represent long-term planned features that will be implemented in future phases.
## Architectural Layers
The SOC architecture is organized into distinct functional layers that work together to provide end-to-end security operations:
Network-based intrusion detection and prevention systems that monitor traffic from endpoints
* Snort IDS (rule-based detection)
* Suricata IDS/IPS (high-performance detection)
Log collection and processing pipeline for normalizing and enriching security events
* Logstash/Fluentd (log aggregation)
* Elasticsearch (event storage and search)
Infrastructure and application monitoring for availability, performance, and metrics
* Zabbix (infrastructure monitoring)
* Prometheus (metrics and alerts)
Unified security platform for visualization, correlation, and endpoint protection
* Wazuh (SIEM/XDR capabilities)
Security incident tracking, investigation, and case management
* TheHive (incident response platform)
Automated response and infrastructure management
* Cortex (SOAR)
* Terraform/PyInfra (Infrastructure as Code)
## Data Flow Architecture
The architecture implements three primary data flows that ensure comprehensive security visibility:
**Endpoints → IDS (Snort/Suricata) → Logstash → Elasticsearch → Wazuh**
Network traffic from endpoints is analyzed by intrusion detection systems. Detected events are sent to the log aggregation pipeline, stored in Elasticsearch, and visualized in Wazuh for correlation and analysis.
**Endpoints → Firewall → Zabbix → Prometheus → Wazuh**
Infrastructure health and performance metrics flow through monitoring systems. Zabbix tracks availability and performance, Prometheus provides real-time metrics and alerting, and all data is integrated into Wazuh for unified visibility.
**Wazuh → TheHive → Cortex**
Security events identified in Wazuh trigger incident tickets in TheHive. Cortex orchestrates automated response actions based on predefined playbooks, enabling rapid containment and remediation.
**Honeypots/VPN → Logstash/Wazuh** *(Long-term plan)*
Planned integration of deception technology and secure remote access with the core security platform.
## Layer Deep Dive
### Detection Layer: IDS/IPS
The first line of defense monitors network traffic for malicious activity:
Snort provides lightweight, signature-based intrusion detection. It uses a comprehensive rule set to identify known attack patterns and suspicious network behavior.
**Key Capabilities**:
* Real-time traffic analysis
* Protocol analysis
* Content searching/matching
* Packet logging
Suricata offers advanced detection capabilities with multi-threading support for high-performance environments.
**Key Capabilities**:
* Multi-threaded processing
* IDS and IPS modes
* File extraction and analysis
* Lua scripting support
* TLS/SSL inspection
### Aggregation and Storage
Centralized log collection and storage enable correlation and forensic analysis:
**Logstash/Fluentd** act as the data pipeline, ingesting logs from multiple sources, parsing and normalizing data, and enriching events with additional context before forwarding to storage.
**Elasticsearch** provides the scalable storage backend with powerful search and analytics capabilities, enabling rapid queries across millions of security events.
### Infrastructure Monitoring
Comprehensive monitoring ensures security events are correlated with infrastructure health:
* **Zabbix**: Monitors server availability, resource utilization, and application performance. Provides alerting for infrastructure anomalies that may indicate security issues.
* **Prometheus**: Collects time-series metrics with a flexible query language, enabling real-time alerting and integration with visualization tools.
### Central Security Platform: Wazuh
Wazuh serves as the unified security platform, providing:
Customizable dashboards for real-time security event monitoring
Intelligent correlation rules to detect complex attack patterns
Endpoint detection and response for host-based security
Built-in compliance frameworks and reporting
### Incident Management and Orchestration
The incident response layer enables efficient security operations:
TheHive provides collaborative incident management with case tracking, task assignment, and investigation workflows. Security analysts can document findings, share intelligence, and track incident resolution.
Cortex automates repetitive security tasks through analyzers and responders. It can automatically enrich indicators, execute response actions, and integrate with external threat intelligence sources.
Infrastructure as Code tools enable automated deployment, configuration management, and response actions at the infrastructure level, ensuring consistent and repeatable security controls.
## Long-Term Planned Components
The following components are planned for future implementation and are shown in **yellow** in the architecture diagram:
These components represent the long-term vision and are subject to evaluation before implementation.
Virtualized deception technology to attract attackers and gather intelligence on tactics and techniques
Open-source perimeter firewall for network segmentation, traffic filtering, and additional intrusion prevention
Mesh VPN solution for secure remote access to the SOC infrastructure and management interfaces
## Integration Points
The architecture emphasizes seamless integration between components:
* **Bidirectional data flow** between monitoring and security platforms
* **Standardized log formats** for consistent parsing and correlation
* **API-based integration** for automated orchestration
* **Centralized authentication** (where applicable)
* **Unified alerting** through the Wazuh platform
The modular design allows components to be deployed incrementally, starting with core detection and monitoring capabilities and expanding to advanced orchestration and automation.
## Scalability Considerations
The architecture is designed to scale across multiple dimensions:
* **Horizontal scaling**: Add more IDS sensors, log processors, and storage nodes
* **Vertical scaling**: Increase resources for compute-intensive components like Elasticsearch
* **Geographic distribution**: Deploy regional sensors with centralized management
* **Data retention**: Configure tiered storage for cost-effective long-term retention
## Next Steps
To understand the design philosophy behind this architecture, continue to the [Design Principles](/design-principles) section. For detailed information about specific components, explore the Components section of the documentation.